
Written by
Lukas
•
•
Projects

Aircraft have TCAS — a system that warns pilots 25 seconds before a potential collision. Twenty-five seconds is enough to correct course, gain altitude, prevent disaster. Your projects have a weekly standup and hope.
This isn't hyperbole. In aviation, a network of sensors, transponders, and algorithms decides in real time whether a plane is on track. In project management — where solid project forecasting could prevent most disasters — it's often a gut feeling in the weekly sync. The result: 71% of IT projects exceed their budget — by an average of 43% (Standish Group, CHAOS Report).
The good news: you don't need a million-dollar system to spot problems early. You need a few sharp questions, real numbers instead of estimates, and a weekly rhythm that surfaces deviations before they escalate.
The Two Questions That Make or Break Every Status Meeting
Good project forecasting doesn't start with tools — it starts with the right questions. Most status meetings don't fail because of missing information. They fail because of the wrong questions. "How far along are you?" produces percentages that nobody can verify. 80% done can mean anything — from "we're cruising" to "we haven't touched the hardest 20% yet."
Instead of asking for progress, which is always subjective, two questions work far better:
Question 1: The pace check. How many hours have we burned — and how many do we need for what's left? This isn't rocket science. It's arithmetic. But surprisingly few teams do it regularly.
Question 2: The bottleneck check. What's stuck right now — and why? Not "are there any issues" (everyone says no), but: which ticket hasn't moved in three days? Who's waiting on whom?
When your project status is built on these two data points, meetings get shorter — and more honest.
Forecasting With Real Numbers, Not Estimates
Effective project forecasting lives on real numbers, not estimates. Here's an example. A web project has a budget of 400 hours. Six weeks in, 280 hours are spent. The project lead says: "We're on track." Are you, though?
The open tickets add up to an estimated 180 hours of remaining work. 280 spent, 180 still needed — that's 460 hours against a 400-hour budget. The project isn't "on track." It's heading for a 15% overrun.
Data from the CHAOS Report and Clear Star analysis shows: projects with poor decision latency burn up to 50% of their budget on decisions alone — compared to 10% in well-managed projects.
This pattern shows up across IT projects of all sizes. For every million dollars in personnel costs, roughly 1,000 decisions need to be made. If each decision takes four hours instead of one, the decision overhead alone rivals the actual project work. It's not the code that blows budgets. It's the waiting.
Running this calculation once a week — hours burned versus estimated remaining effort versus budget — gives you an early warning system. Not a perfect one. But a working one.
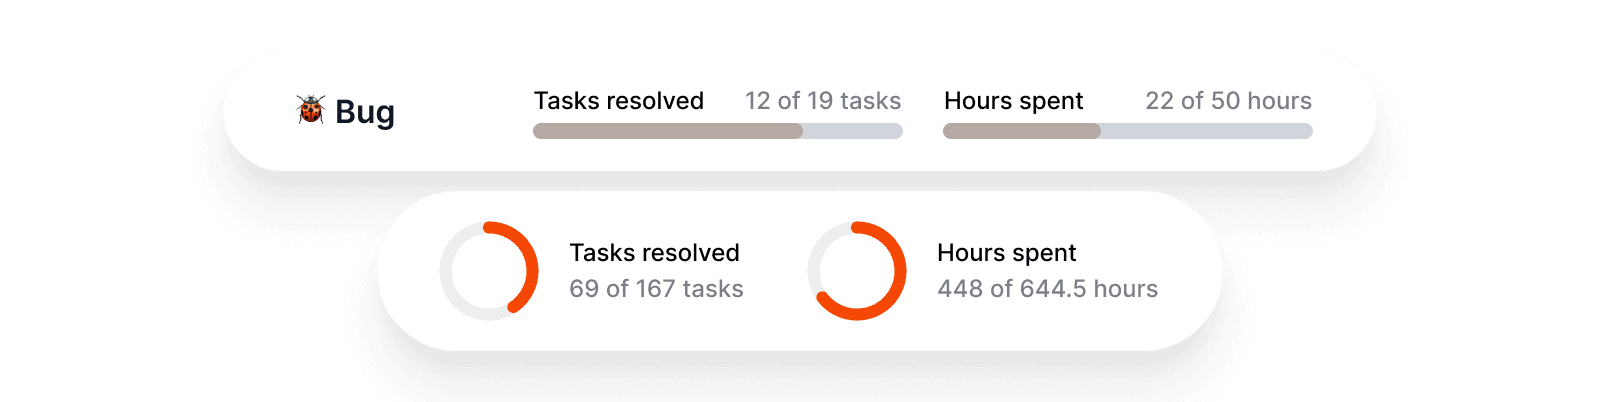
In Leadtime, this forecast shows up as a line: where the project stands today, and where it's headed if the current pace continues. The red zone isn't a verdict — it's an invitation to act now, not next week.
Making Bottlenecks Visible — Before They Escalate
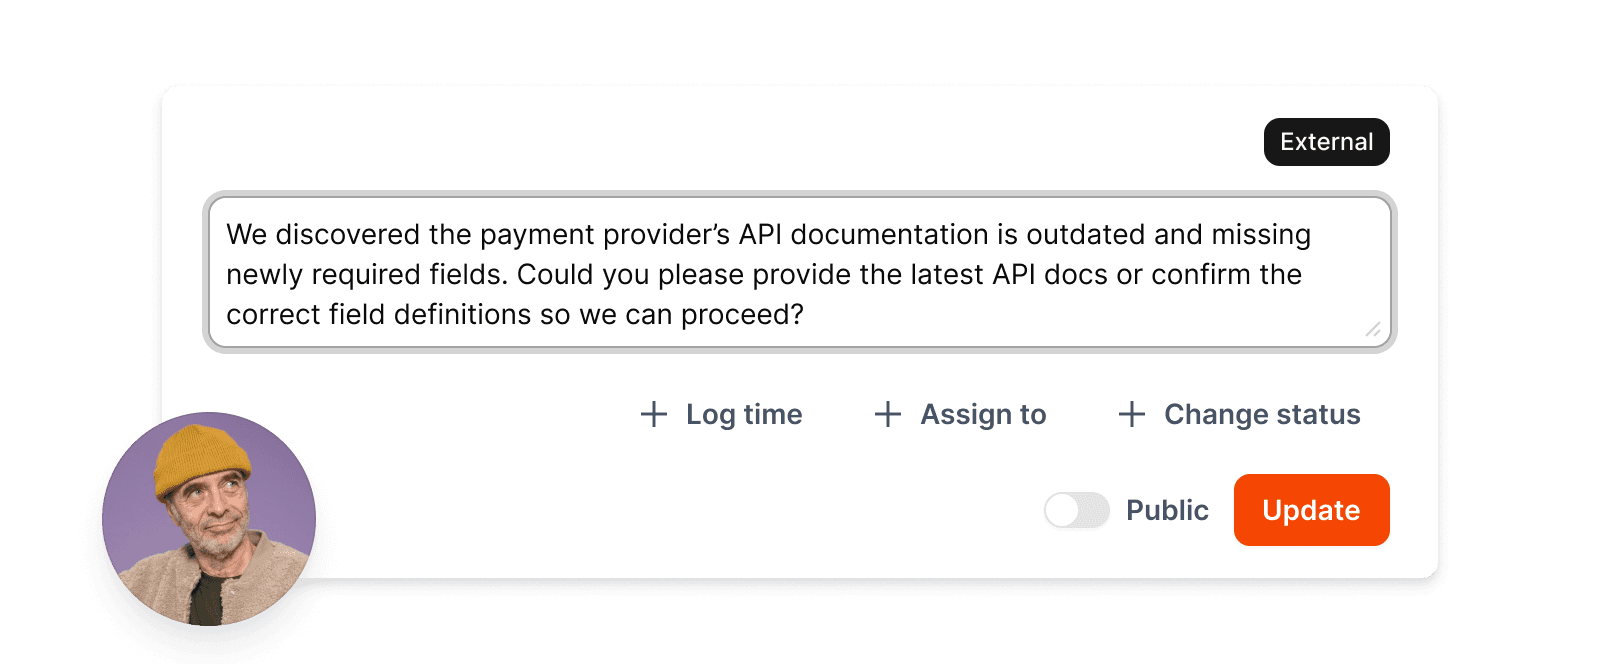
A project in Karlsruhe, payment gateway integration. Four developers, eight weeks, clear scope. Three weeks in, one ticket had been stuck for five days: "Payment provider API documentation unclear." Nobody escalated. Nobody asked. The ticket sat on "In Progress" — technically correct, practically dead.
These bottlenecks cost more than the hours themselves. They block downstream tasks, push milestones, and create a pressure wave that hits the entire project. The trend is measurable: cost overruns in IT projects rose from 19.4% in 2014 to 21.9% in 2023 (PRAGATI analysis). We've looked at why IT projects keep failing at the same points before — bottlenecks are a central theme.
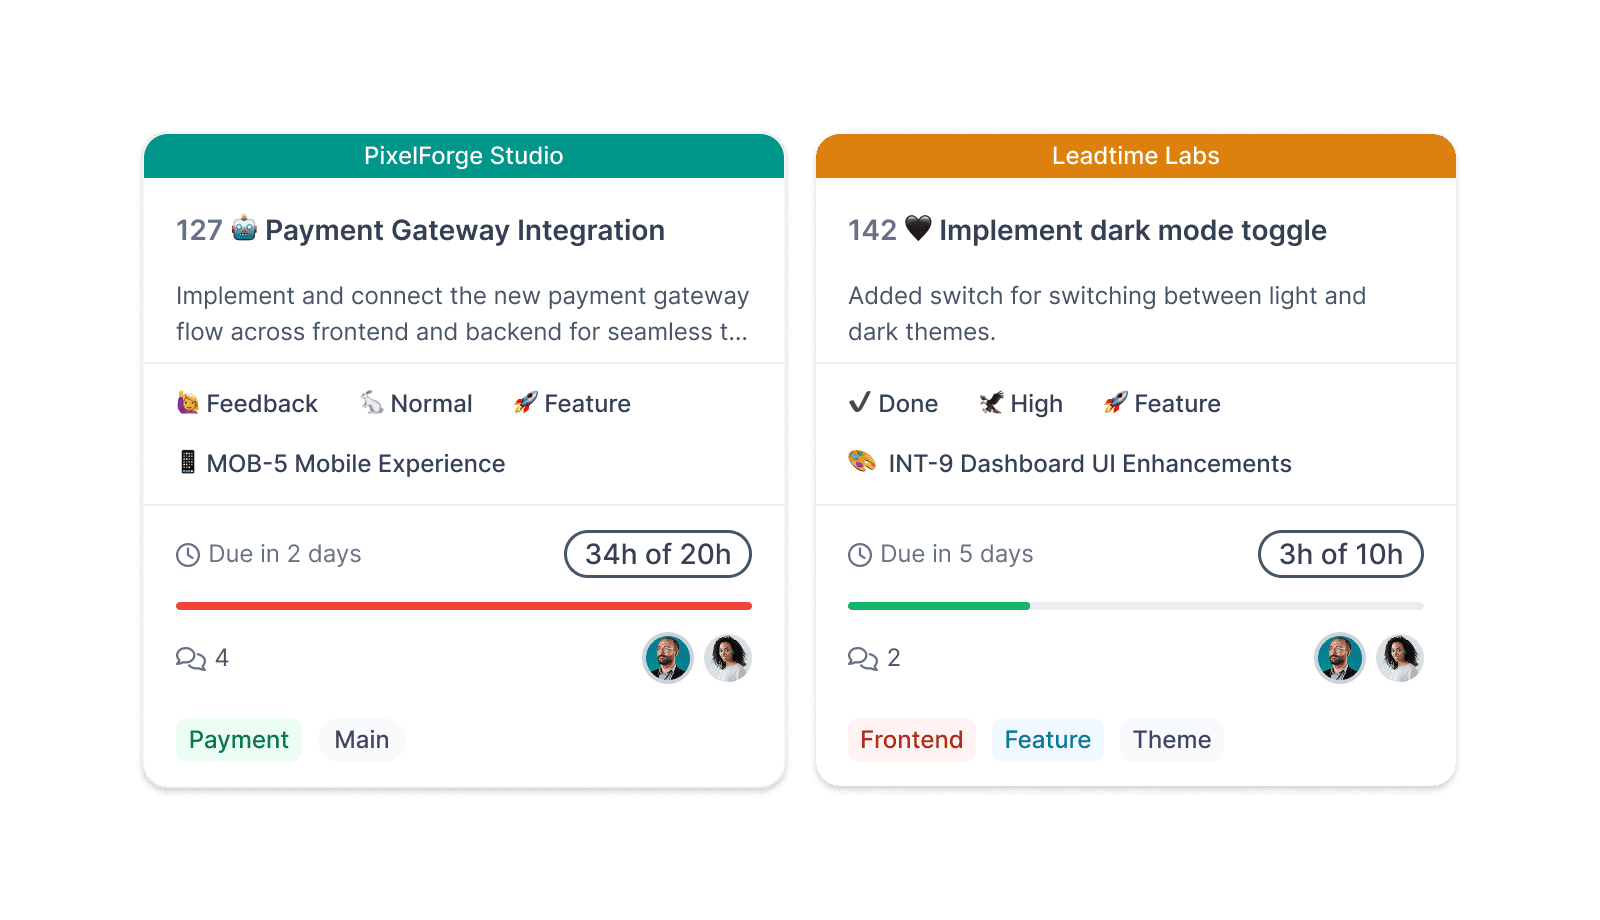
A simple color system helps: green means the ticket is moving, red means it's stalled. Not as punishment — as information. In aviation, every aircraft broadcasts its position and speed via ADS-B in real time. By the same logic, every ticket should make its health status visible.
The goal isn't micromanagement. The goal is that a project lead grabs their morning coffee, glances at the board, and knows within ten seconds: this is where I need to step in today. Everything else is fine.
The Weekly Rhythm as an Early Warning System
Air traffic controllers don't correct course deviations once a week. They do it continuously. For projects, continuously is unrealistic — but once a week is the minimum that works.
A solid weekly sync needs four items:
The pace check shows whether the budget holds. The bottleneck check reveals what's stuck. A brief forecast shows where the project will be in two weeks if nothing changes. And a decision list ensures open questions don't wait until the next meeting.
Sounds simple. It is. But most teams spend their weeklies on status reports rather than decisions. The difference is fundamental: a status report looks backward. An early warning system looks forward. If you're wondering why traditional planning tools fail at exactly this — an honest look at Gantt charts is worth your time.
Teams that take the rhythm seriously and use their time tracking consistently build an increasingly accurate picture of how their team actually works — not how they think it works.
Why This Decides Success or Failure
In aviation, there's a concept called the drift indicator. Air traffic controllers don't just see where a plane is — they see where it's drifting. Wind, weather, deviations aren't corrected once the aircraft has gone off course. They're corrected as soon as the tendency becomes visible.
Project forecasting works on the same principle. The deviation itself isn't the problem — it's how late you notice it. A project that's 5% over budget in week 3 can be corrected: reduce scope, reallocate resources, have a conversation with the client. A project that's 40% over budget in week 8 has no options left.

The data is usually there. In the time tracking, in the tickets, in the budgets. What's missing is the view that brings it all together — a dashboard that doesn't show 47 metrics but the three that matter today. Teams that connect their resource management with project budget tracking in one system can stop flying blind.
We built Leadtime Project Analytics because we spent years trying to keep track of projects with spreadsheets. It worked — about as well as navigating with a paper map on the highway. Technically possible. Practically an adventure you could do without.


