
Written by
Lukas
•
•
Resource Management

Every day, roughly 27,000 flights take off across Europe. Not one of them launches because an air traffic controller had "a good feeling about it." There are radar screens, time slots, minimum separation distances, and an entire system that plans every route before the engines start. And still, bottlenecks happen — not because the technology fails, but because capacity is finite and weather doesn't care about your schedule.
In IT agencies and software companies, things work differently. Someone sits down on Monday morning, stares at a half-maintained project plan, glances at the team roster, and starts assigning tasks based on the principle: Who hasn't said no yet? Anyone who's ever juggled three client projects at once knows what comes next. Someone is drowning, someone else is waiting for input, and the project lead spends half the day reshuffling workloads they can't actually see.
What Air Traffic Controllers Do Better Than Most Project Managers
The analogy is unfair, sure. Controllers have radar. Project managers have a Kanban board and good intentions. But the point is a different one: In aviation, capacity planning isn't an optional process you introduce when things get chaotic. It's the baseline requirement for anything to fly at all.
Eurocontrol publishes a telling number: When European airspace is pushed just 10% beyond its capacity threshold, delays don't increase by 10%. They explode — by a factor of 3 to 5. The relationship between utilization and chaos isn't linear. It's exponential.
The same dynamic plays out in project teams. The Standish Group CHAOS Report has documented for decades that 66% of all IT projects exceed their budget or timeline. What often gets missed: The most common cause isn't poor project management in the traditional sense. It's resource overload — too many tasks on too few people, without anyone having a full picture.
66% of IT projects blow their budget or timeline. The most common cause: Nobody has a real-time view of actual team workload.
So the air traffic control lesson isn't "plan better." It's: Without real-time capacity data, you're not planning at all. You're just reacting.
Why "Distribute Evenly" Doesn't Work
The default instinct with team capacity planning is almost always the same: everyone gets an equal share. 40 hours a week, 80% bookable, the rest is buffer. Sounds logical. Almost never works in practice.
Anyone running IT teams knows why. The senior developer who serves as the go-to person across three projects might have 32 planned hours on paper. In reality, she spends 15 hours on unplanned code reviews, architecture decisions, and onboarding a new colleague. The junior developer, meanwhile, has 40 planned hours but only needs 25 because he's waiting on approvals.
The issue isn't a lack of planning. The issue is that most teams build their workload planning on target values instead of real data. If you've never measured how much time actually flows into unplanned work, you're planning with a number that's wrong. And wrong numbers create exactly the delivery bottlenecks you were trying to avoid.
The Gap Between Planned Allocation and Real Availability
In practice, these two figures are often 30-40% apart. An IPMA study shows that project managers overestimate their team's available capacity by an average of 28%. That's not a planning error — it's structural self-deception. Loading teams at 100% planned capacity doesn't yield 100% productivity. It yields stress, quality issues, and turnover.

Capacity Planning in Practice: The Pipeline
All of this sounds reasonable, right? The problem was never the theory. Every CEO nods when you tell them capacity planning matters. The real question was always: How do I actually do this without spending half my day in spreadsheets?
At Leadtime, we spent a long time thinking about how to make team capacity planning practical — something that works without becoming an end in itself. The answer turned out to be surprisingly simple: a visual pipeline built on actual time tracking data.
The principle: Instead of abstract numbers in a table, you see at a glance who's working on what, when — and where gaps or overloads are emerging. Not as a forecast based on estimates, but as a continuously updated picture fed by real bookings.
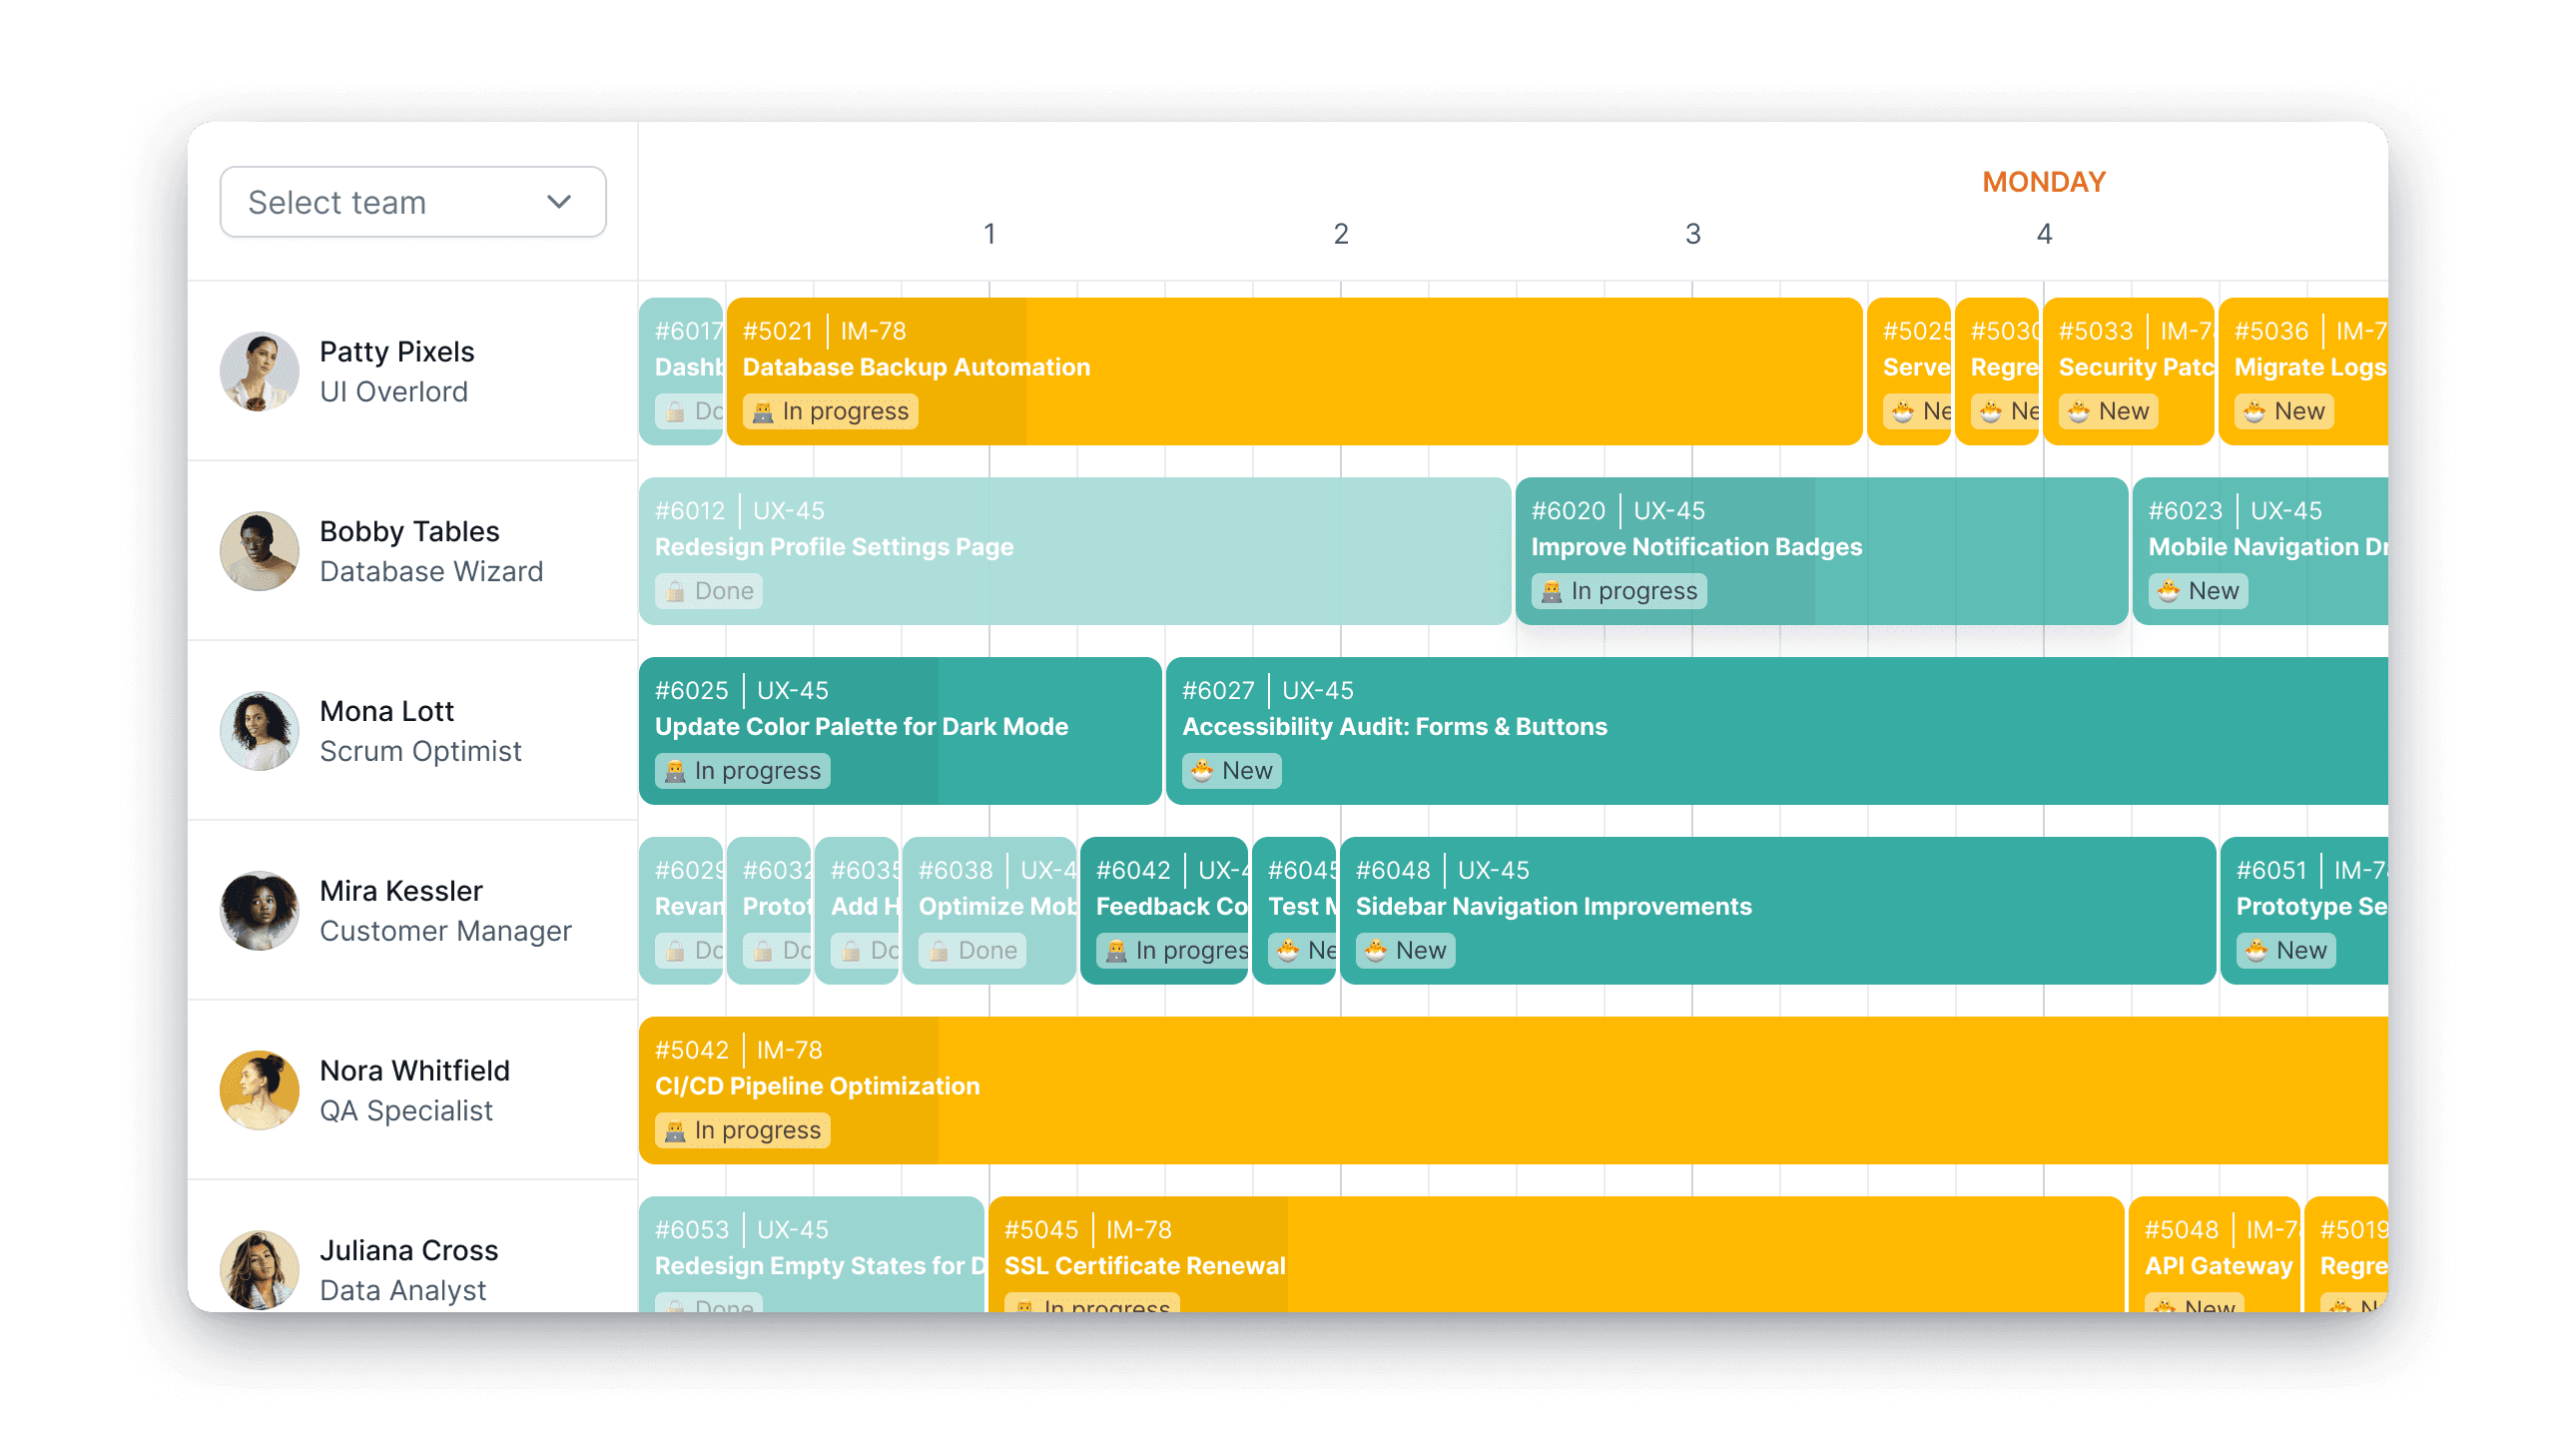
What stands out: Teams that previously worked with Gantt charts or spreadsheets immediately spot patterns that were invisible before. The one person who's chronically overbooked. The project that keeps consuming capacity without showing up in the plan. The gap two weeks from now that you can still fill — instead of discovering it on Friday afternoon.
Spreadsheets vs. Visual Capacity Planning
I'd guess at least half the teams reading this still use a spreadsheet for their capacity planning. No judgment. Excel is the Swiss Army knife of business management. It does everything. It just doesn't do any of it particularly well when it comes to dynamic workload planning.
The core problem with spreadsheets as a capacity planning tool: They show a snapshot, not a trajectory. You see what's planned — but not what's actually happening. There's no connection between the plan and reality, between booked time and available time. Every change — a sick day, a new project, scope creep — requires manual updates. And let's be honest: Who's still maintaining the resource plan on Friday evening?
When the Spreadsheet Lies
At my previous company, I watched a meticulously maintained Excel capacity plan give us months of false confidence. Until someone resigned and we realized they'd been slotted into three projects — while half their tasks had quietly been picked up by someone else, without any of that showing up anywhere. The spreadsheet said: one problem. Reality was: a completely different problem we'd been blind to.
Visual capacity planning works differently. It updates itself because it sits on the same data as your time tracking and project management. When someone logs four hours on Project A, the pipeline adjusts automatically. No manual updates, no hoping the spreadsheet is current.
As far as I can tell after 15 years in IT services, most capacity planning efforts don't fail because of the method. They fail because they require manual maintenance — and nobody keeps that up past the first two weeks of enthusiasm.
What Changes When You Know Instead of Hope
There's a moment that most teams describe when they switch from spreadsheets to real capacity planning. It's not the "wow, finally a dashboard" moment. It's the moment someone says for the first time: "Wait, we can't actually start that project next week — Lisa is fully booked."
Sounds trivial. It isn't. Because until then, the answer to "Can we start this next week?" was always: "Should be fine." And "should be fine" is the sentence that kills most projects. Not at the start. But three weeks later, when delays are stacking up and nobody can say exactly why.
What great teams do: They make decisions based on data, not hope. And for that, they need a system that shows real-time utilization — not what it should look like, but what it actually looks like.
The Domino Effect Nobody Sees
What makes capacity planning so tricky: A single overload rarely stays contained. If Lisa is overbooked in week 12, her deliverable slips to week 13. That blocks the review in week 14. Suddenly the client project is three weeks behind because a month ago, nobody noticed one person had 20 hours too many on their plate. If you want to scale your agency, you need to understand these chain reactions — and stop them before they start.

The data, at least, suggests the difference is substantial. PMI studies show that organizations with structured resource planning see 28% fewer project cancellations. Not because they plan better — but because they spot the warning signs before a plan falls apart.
We built Leadtime because we were tired of starting every Monday morning on a blind flight. Not because we thought we knew better — but because we wanted to at least know what we didn't know.


